
Go pprof Profile.WriteTo 怎样控制 debug 输出级别
来源:17golang原创
时间:2026-11-13 21:33:15 224浏览 收藏
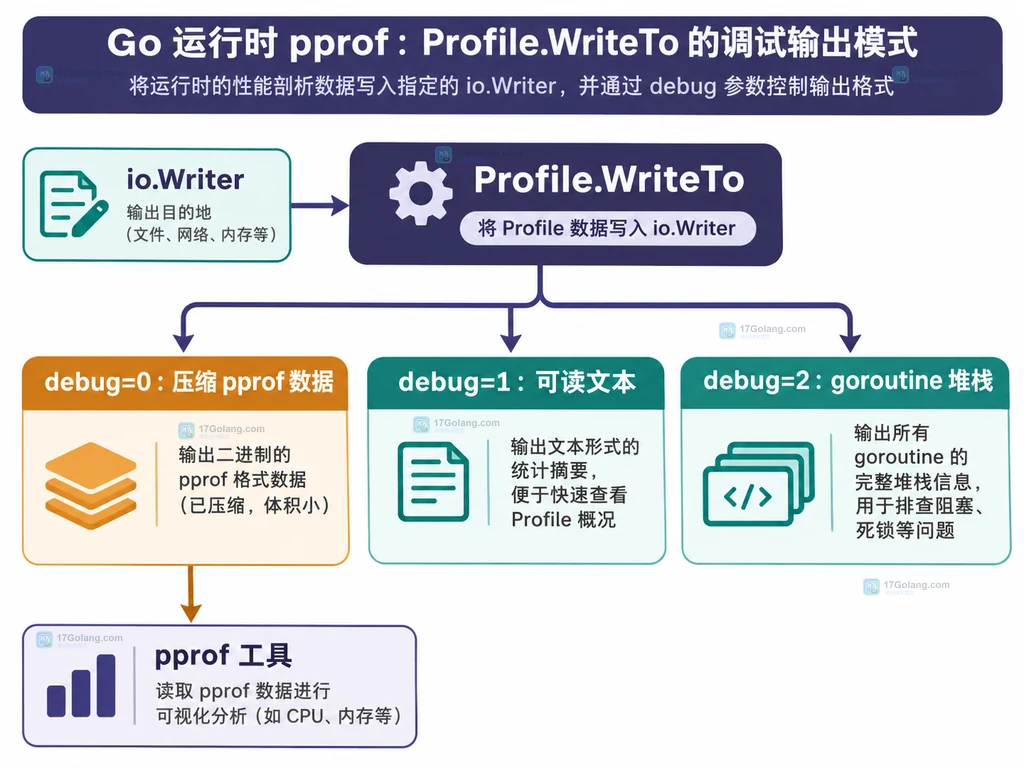
如果你在 Go 里调用 runtime/pprof.Profile.WriteTo 后发现文件打不开、终端里看不到可读文本,通常不是 Profile 没有采样,而是把 debug 当成“日志详细程度”了。它实际决定输出格式:0 适合保存为 pprof 数据供工具分析,1 适合直接阅读,goroutine profile 还对 2 定义了 panic 风格的堆栈输出。
官方文档:https://pkg.go.dev/runtime/pprof
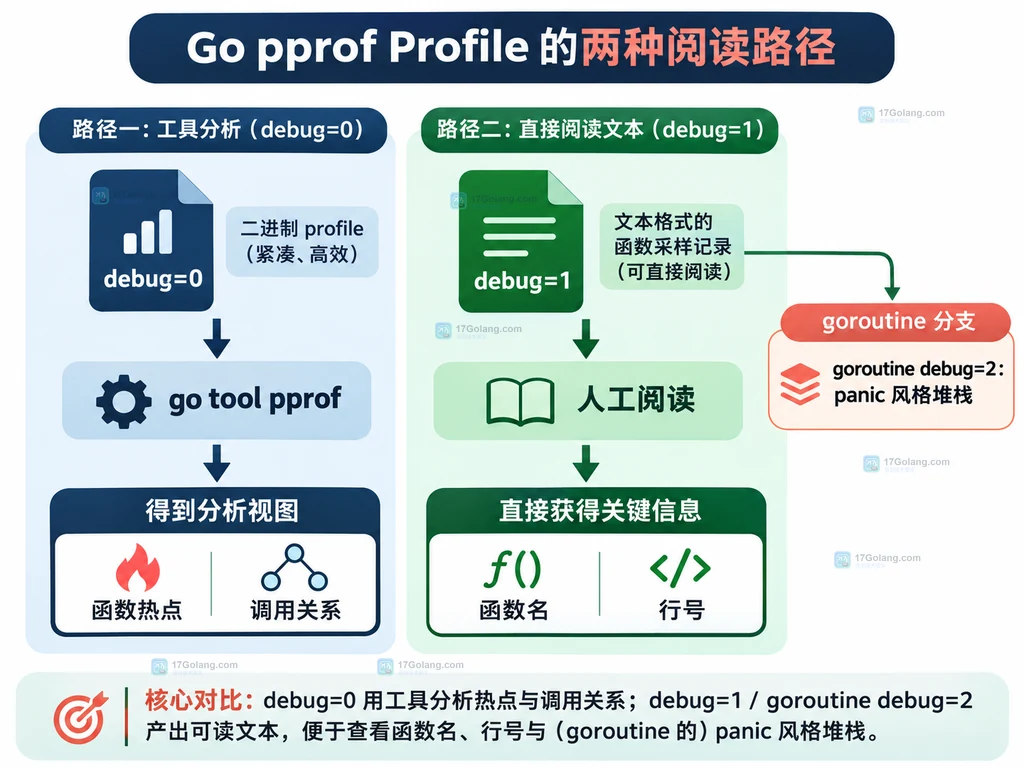
最小判断可以记成:要交给go tool pprof,用debug=0;要在工单或终端里快速看函数和行号,用debug=1;只有查看 goroutine 堆栈时,再考虑它专门定义的debug=2。
先把 debug 当成输出格式开关
WriteTo 的签名是 WriteTo(w io.Writer, debug int) error。第一个参数决定写到哪里,第二个参数决定怎么写。它不是通用的采样倍率,也不会让 Profile 自动收集更多样本。
| debug 值 | 输出形态 | 适合场景 |
|---|---|---|
| 0 | gzip 压缩的 pprof 协议缓冲 | 保存文件、交给 go tool pprof 或其它 pprof 工具 |
| 1 | 旧式可读文本,并补充函数名与行号注释 | 人工排障、日志附件、没有分析工具的环境 |
| 2 | 只对预定义的 goroutine profile 有特殊含义 | 需要接近未恢复 panic 的 goroutine 堆栈形态 |
因此,“输出为空”与“输出不可读”要分开处理:前者先看 Profile 是否选对,后者先看是否把二进制的 debug=0 当成纯文本打开。
最小配方:保存可分析的 pprof 文件
默认推荐从 debug=0 开始。这个模式保留了 pprof 工具需要的结构,适合先落盘再分析,而不是把分析结果过早变成字符串。
package main

import (
    "log"
    "os"
    "runtime/pprof"
)

func saveProfile(path string) error {
    // 以二进制 pprof 格式保存,后续可以交给 go tool pprof。
    file, err := os.Create(path)
    if err != nil {
        return err
    }
    defer func() {
        // 关闭文件,避免采样文件句柄泄漏。
        _ = file.Close()
    }()

    profile := pprof.Lookup("goroutine")
    if profile == nil {
        return nil
    }
    // debug=0 不是“最少采样”,而是标准压缩协议输出。
    return profile.WriteTo(file, 0)
}

func main() {
    if err := saveProfile("goroutine.prof"); err != nil {
        log.Fatal(err)
    }
}
这里的 goroutine.prof 不应该用文本编辑器判断内容是否正常。它的用途是继续执行类似 go tool pprof goroutine.prof 的分析操作;如果只是想在终端里读堆栈,见下一节。
需要人读时,用 debug=1 输出文本
debug=1 会输出旧式文本格式,并把地址翻译成函数名和行号注释。它适合把一次采样附在问题单里,也适合临时写入 bytes.Buffer 后打印。
package main

import (
    "bytes"
    "fmt"
    "log"
    "runtime/pprof"
)

func printGoroutines() error {
    var buf bytes.Buffer
    profile := pprof.Lookup("goroutine")
    if profile == nil {
        return fmt.Errorf("goroutine profile is unavailable")
    }

    // debug=1 产生面向人的文本,便于排查调用栈和行号。
    if err := profile.WriteTo(&buf, 1); err != nil {
        return err
    }
    // 只在写入成功后输出,避免把不完整快照误当成完整结果。
    fmt.Print(buf.String())
    return nil
}

func main() {
    if err := printGoroutines(); err != nil {
        log.Fatal(err)
    }
}
这个模式的代价是输出更适合阅读,却不再是你保存给 pprof 工具的首选载体。实际排障时可以同时保留两份:一份 debug=0 原始文件,一份 debug=1 文本摘要。
goroutine profile 的 debug=2 不是通用“更详细”
预定义 Profile 可以给不同 debug 值定义自己的含义。对 goroutine 而言,debug=2 会按 Go 程序发生未恢复 panic 时接近的形式打印 goroutine 堆栈。因此它是某个 Profile 的特殊约定,不应该套用到 heap、allocs 或 block 等其它 Profile 上。
func writeGoroutineStacks(w io.Writer, level int) error {
    profile := pprof.Lookup("goroutine")
    if profile == nil {
        return fmt.Errorf("goroutine profile is unavailable")
    }

    // 只有 goroutine profile 使用 level=2 表达 panic 风格堆栈。
    if level != 1 && level != 2 {
        return fmt.Errorf("unsupported goroutine debug level: %d", level)
    }
    return profile.WriteTo(w, level)
}
如果你要的是机器分析文件,仍然应使用 0;如果你要的是人能快速定位阻塞位置的堆栈,1 或 2 才有意义。不要因为数字更大,就把它理解为采样更充分。
几个容易踩到的边界
- debug=0 输出不是损坏文件。它是压缩协议数据,应该交给 pprof 工具处理。
- WriteTo 的错误要保留。Writer 返回错误时,快照可能不完整,不能只看已经写出的前几行。
- Profile 类型决定特殊级别。不要把 goroutine 的
debug=2规则推广到所有 Profile。 - 输出格式不等于采样质量。Profile 的内容还取决于所选 Profile、采样开关和采集时机。
- 调试输出和生产采集分开考虑。Go 的诊断工具可能带来开销,生产环境应单独评估采集频率和并发影响。
完整选择建议
可以把调用前的判断压缩成三句话:准备交给工具分析,就写 debug=0;准备让人直接读,就写 debug=1;只有明确处理 goroutine 堆栈,并且需要 panic 风格时,才写 debug=2。如果同时需要可追溯性,保留一份原始 pprof 文件,再生成一份文本副本,排查和复盘会更稳。
相关问题:
- 为什么用文本编辑器打开 debug=0 是乱码?因为它是 gzip 压缩的 pprof 协议缓冲,不是纯文本。
- debug=1 会不会增加采样数量?不会,它只改变写出时的表达形式。
- heap profile 能不能直接使用 debug=2?不要这样假设;特殊 debug 值要以具体 Profile 的文档约定为准。
-
369 收藏
-
344 收藏
-
464 收藏
-
327 收藏
-
349 收藏
-
137 收藏
-
295 收藏
-
101 收藏
-
373 收藏
-
Golang · Go教程 | 12分钟前 | 标准库 · JSON · 错误处理 · 数据校验 · Go教程 · Go IsValid encoding/json/jsontext jsontext.Value JSON片段 WriteValue280 收藏
-
143 收藏
-
Golang · Go教程 | 16分钟前 | 标准库 · JSON · 错误处理 · Go教程 · 接口设计 · Go 结构体标签 encoding/json/v2 RejectUnknownMembers JSON严格解码418 收藏
-
Golang · Go教程 | 24分钟前 | 连接池 · Go教程 · database/sql · Go 连接池 database/sql DBStats sql.DB SetMaxIdleConns293 收藏
-
306 收藏
-
Golang · Go教程 | 1天前 | 依赖管理 · Go教程 · 工程实践 · Go vendor 离线构建 Go Modules go mod vendor modules.txt 依赖一致性132 收藏
-
124 收藏
-
338 收藏
-
- 前端进阶之JavaScript设计模式
- 设计模式是开发人员在软件开发过程中面临一般问题时的解决方案,代表了最佳的实践。本课程的主打内容包括JS常见设计模式以及具体应用场景,打造一站式知识长龙服务,适合有JS基础的同学学习。
- 立即学习 543次学习
-

- GO语言核心编程课程
- 本课程采用真实案例,全面具体可落地,从理论到实践,一步一步将GO核心编程技术、编程思想、底层实现融会贯通,使学习者贴近时代脉搏,做IT互联网时代的弄潮儿。
- 立即学习 516次学习
-
- 简单聊聊mysql8与网络通信
- 如有问题加微信:Le-studyg;在课程中,我们将首先介绍MySQL8的新特性,包括性能优化、安全增强、新数据类型等,帮助学生快速熟悉MySQL8的最新功能。接着,我们将深入解析MySQL的网络通信机制,包括协议、连接管理、数据传输等,让
- 立即学习 500次学习
-
- JavaScript正则表达式基础与实战
- 在任何一门编程语言中,正则表达式,都是一项重要的知识,它提供了高效的字符串匹配与捕获机制,可以极大的简化程序设计。
- 立即学习 487次学习
-

- 从零制作响应式网站—Grid布局
- 本系列教程将展示从零制作一个假想的网络科技公司官网,分为导航,轮播,关于我们,成功案例,服务流程,团队介绍,数据部分,公司动态,底部信息等内容区块。网站整体采用CSSGrid布局,支持响应式,有流畅过渡和展现动画。
- 立即学习 485次学习