Prometheus&Grafana性能监控
来源:SegmentFault
时间:2023-01-26 19:52:53 106浏览 收藏
怎么入门数据库编程?需要学习哪些知识点?这是新手们刚接触编程时常见的问题;下面golang学习网就来给大家整理分享一些知识点,希望能够给初学者一些帮助。本篇文章就来介绍《Prometheus&Grafana性能监控》,涉及到MySQL、docker、Redis、prometheus、linux运维,有需要的可以收藏一下
- 更多exporters可参看EXPORTERS AND INTEGRATIONS
- 对应端口号Default port allocations · prometheus/prometheus Wiki · GitHub
架构
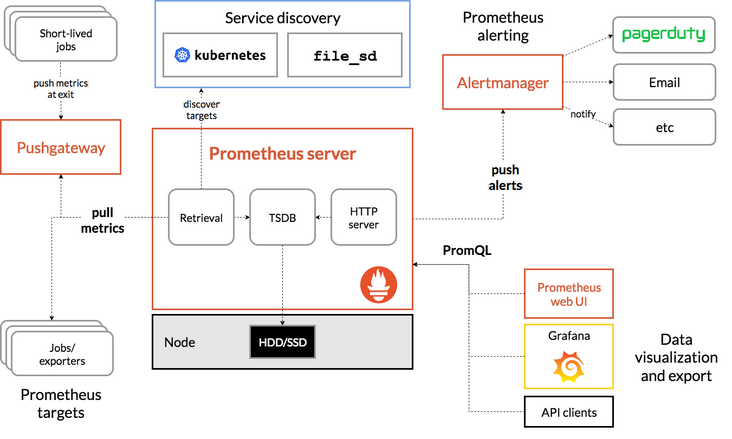
Grafana
- Grafana是一个跨平台的开源的度量分析和可视化工具,可以通过将采集的数据查询然后可视化的展示,并及时通知。
特点
- 展示方式:快速灵活的客户端图表,面板插件有许多不同方式的可视化指标和日志,官方库中具有丰富的仪表盘插件,比如热图、折线图、图表等多种展示方式;
- 数据源:Graphite,InfluxDB,OpenTSDB,Prometheus,Elasticsearch,CloudWatch和KairosDB等;
- 通知提醒:以可视方式定义最重要指标的警报规则,Grafana将不断计算并发送通知,在数据达到阈值时通过Slack、PagerDuty等获得通知;
- 混合展示:在同一图表中混合使用不同的数据源,可以基于每个查询指定数据源,甚至自定义数据源;
- 注释:使用来自不同数据源的丰富事件注释图表,将鼠标悬停在事件上会显示完整的事件元数据和标记;
- 过滤器:Ad-hoc过滤器允许动态创建新的键/值过滤器,这些过滤器会自动应用于使用该数据源的所有查询
安装部署
prometheus
- 手动下载,并根据yml配置文件启动服务
download the latest release
wget https://github.com/prometheus/prometheus/releases/download/v*/prometheus-*.*-amd64.tar.gz
tar xvf prometheus-*.*-amd64.tar.gz
cd prometheus-*
nohup ./prometheus --config.file=./prometheus.yml &
grafana
- 手动下载,并根据yml配置文件启动服务
download the latest release
wget https://dl.grafana.com/oss/release/grafana-7.5.6-1.x86_64.rpm
sudo yum install grafana-7.5.6-1.x86_64.rpm
docker安装
- docker-compose统一安装prometheus及grafana
cd /opt
mkdir -p prometheus/config/
mkdir -p grafana/data
chmod 777 grafana/data
mkdir -p /data/prometheus
chmod 777 /data/prometheus
- 创建
cd /opt/prometheus/config/
touch prometheus.yml
- 编辑
#my global config global: scrape_interval: 15s # Set the scrape interval to every 15 seconds. Default is every 1 minute. evaluation_interval: 15s # Evaluate rules every 15 seconds. The default is every 1 minute. #scrape_timeout is set to the global default (10s). #Alertmanager configuration alerting: alertmanagers: - static_configs: - targets: #- alertmanager:9093 #Load rules once and periodically evaluate them according to the global 'evaluation_interval'. rule_files: #- "first_rules.yml" #- "second_rules.yml" #A scrape configuration containing exactly one endpoint to scrape: #Here it's Prometheus itself. scrape_configs: #The job name is added as a label `job=` to any timeseries scraped from this config. - job_name: 'prometheus' #metrics_path defaults to '/metrics' #scheme defaults to 'http'. static_configs: - targets: ['192.168.9.140:9090'] - job_name: "node" static_configs: - targets: ["192.168.9.140:9100"] - job_name: "qianmingyanqian" static_configs: - targets: ["11.12.108.226:9100","11.12.108.225:9100"] ## config for the multiple Redis targets that the exporter will scrape - job_name: "redis_exporter_targets" scrape_interval: 5s static_configs: - targets: - redis://192.168.9.140:6379 - redis://192.168.9.140:7001 - redis://192.168.9.140:7004 metrics_path: /scrape relabel_configs: - source_labels: [__address__] target_label: __param_target - source_labels: [__param_target] target_label: instance - target_label: __address__ replacement: 192.168.9.140:9121 - 创建
cd /opt
mkdir docker-compose
touch docker-compose_prometheus_grafana.yml
- 编辑
version: '2' networks: monitor: driver: bridge services: prometheus: image: prom/prometheus:latest container_name: prometheus hostname: prometheus restart: always volumes: - /opt/prometheus/config:/etc/prometheus - /data/prometheus:/prometheus ports: - "9090:9090" expose: - "8086" command: - '--config.file=/etc/prometheus/prometheus.yml' - '--log.level=info' - '--web.listen-address=0.0.0.0:9090' - '--storage.tsdb.path=/prometheus' - '--storage.tsdb.retention=15d' - '--query.max-concurrency=50' networks: - monitor grafana: image: grafana/grafana:latest container_name: grafana hostname: grafana restart: always volumes: - /opt/grafana/data:/var/lib/grafana ports: - "3000:3000" - "26:26" networks: - monitor depends_on: - prometheus- docker-compose运行docker容器
docker-compose -p prometheus_grafana -f docker-compose_prometheus_grafana.yml up -d
- 启动成功通过浏览器
wget https://github.com/prometheus/node_exporter/releases/download/v*/node_exporter-*.*-amd64.tar.gz
tar xvfz node_exporter-*.*-amd64.tar.gz
cd node_exporter-*.*-amd64
nohup ./node_exporter &
- 或者使用docker安装,创建
cd /opt/docker-compose
touch docker-compose_node-exporter.yml
- 编辑
--- version: '3.8' services: node_exporter: image: quay.io/prometheus/node-exporter:latest container_name: node_exporter command: - '--path.rootfs=/host' network_mode: host pid: host restart: unless-stopped volumes: - '/:/host:ro,rslave'- docker-compose运行docker容器
docker-compose -p node_exporter -f docker-compose_node-exporter.yml up -d
- 尝试访问以下
curl http://192.168.9.140:9100/metrics
- 返回以下数据证明服务正常
# HELP node_xfs_read_calls_total Number of read(2) system calls made to files in a filesystem.# TYPE node_xfs_read_calls_total counternode_xfs_read_calls_total{device="dm-1"} 10196node_xfs_read_calls_total{device="dm-2"} 17401node_xfs_read_calls_total{device="dm-3"} 970node_xfs_read_calls_total{device="dm-4"} 10node_xfs_read_calls_total{device="dm-5"} 19node_xfs_read_calls_total{device="dm-6"} 132node_xfs_read_calls_total{device="sda2"} 16378node_xfs_read_calls_total{device="sda3"} 2.67817784e+09node_xfs_read_calls_total{device="sda6"} 1.053587e+06配置Prometheus
- job_name: "node" static_configs: - targets: ["192.168.9.140:9100"]
- 修改配置文件后需重启
docker restart CONTAINER ID
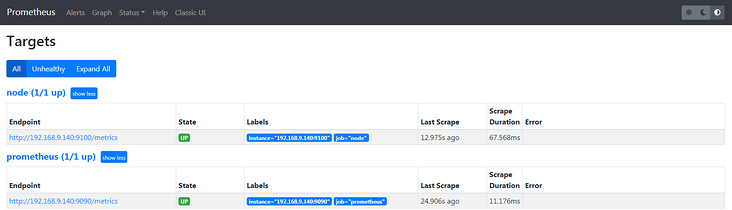
- 成功后如下图
配置Grafana
- 登陆后添加数据源
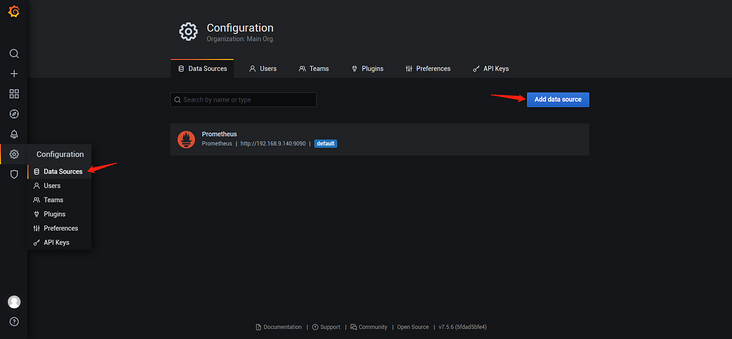
- 选择Prometheus
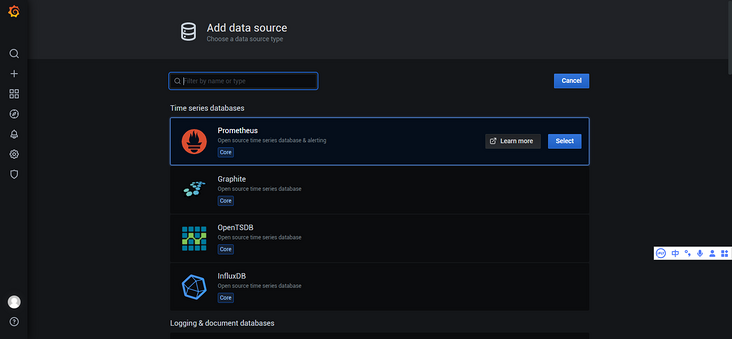
- 在URL输入框键入
wget https://github.com/oliver006/redis_exporter/releases/download/v1.23.1/redis_exporter-v1.23.1.linux-386.tar.gztar zxvf redis_exporter-v1.23.1.linux-386.tar.gznohup ./redis_exporter -redis.addr 192.168.9.140:6379 -redis.password 111111 &
- 或者使用docker安装
docker run -d --name redis_exporter -p 9121:9121 oliver006/redis_exporter --redis.addr=192.168.9.140:6379 --redis.password=111111
配置Prometheus
- redis单实例,
## config for scraping the exporter itself- job_name: 'redis_exporter' scrape_interval: 5s static_configs: - targets:[192.168.9.140:9121]
- redis集群,
## config for the multiple Redis targets that the exporter will scrape - job_name: "redis_exporter_targets" scrape_interval: 5s static_configs: - targets: - redis://192.168.9.140:6379 - redis://192.168.9.140:7001 - redis://192.168.9.140:7004 metrics_path: /scrape relabel_configs: - source_labels: [__address__] target_label: __param_target - source_labels: [__param_target] target_label: instance - target_label: __address__ replacement: 192.168.9.140:9121
- 修改配置文件后需重启
root@localhost 14:43: [(none)]>CREATE USER 'exporter'@'localhost' IDENTIFIED BY 'mysql_exporter';Query OK, 0 rows affected (0.04 sec)root@localhost 14:43: [(none)]>GRANT PROCESS, REPLICATION CLIENT, SELECT ON *.* TO 'exporter'@'localhost';Query OK, 0 rows affected (0.03 sec)
- 创建
cd /opttouch .my.cnfvim .my.cnf
- 配置文件键入以下内容
[ client ]user = exporterpassword = mysql_exporter
- 在待被监控的mysql服务器上下载并安装mysqld_exporter
download the latest release
wget https://github.com/prometheus/mysqld_exporter/releases/download/v*/mysqld_exporter-*.*-amd64.tar.gztar xvfz mysqld_exporter-*.*-amd64.tar.gzcd mysqld_exporter-*.*-amd64nohup ./mysqld_exporter --config.my-cnf=/opt/.my.cnf &
- 或者使用docker安装,创建
cd /opt/docker-composetouch docker-compose_mysqld-exporter.yml
- 编辑
version: '2'networks: monitor: driver: bridgeservices: mysql-exporter: image: prom/mysqld-exporter container_name: mysql-exporter hostname: mysql-exporter restart: always ports: - "9104:9104" networks: - my-mysql-network environment: DATA_SOURCE_NAME: "exporter:mysql_exporter@(192.168.9.140:3306)/"networks: my-mysql-network: driver: bridge
- docker-compose运行docker容器
docker-compose -p mysql_exporter -f docker-compose_mysqld-exporter.yml up -d
配置Prometheus
- job_name: 'mysql' static_configs: - targets: ['192.168.9.140:9104'] labels: instance: mysql
- 修改配置文件后需重启
docker restart CONTAINER ID
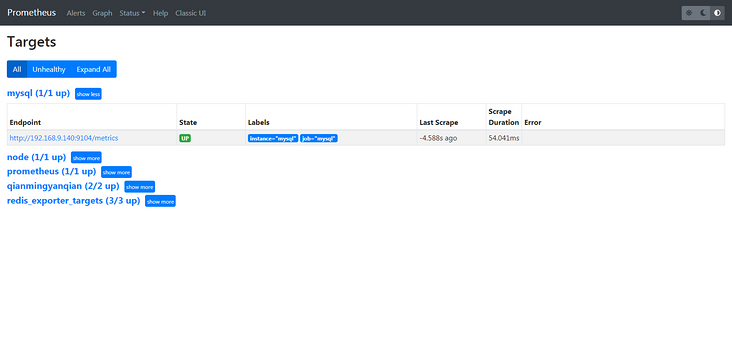
- 成功后如下图
配置Grafana
- 添加Dashboards,导入模板
cd /opt/docker-composetouch docker-compose_cadvisor.yml
- 编辑
version: '3.2'services: cadvisor: image: google/cadvisor:latest container_name: cadvisor restart: unless-stopped ports: - '18080:8080' volumes: - /:/rootfs:ro - /var/run:/var/run:rw - /sys:/sys:ro - /var/lib/docker/:/var/lib/docker:ro
- docker-compose运行docker容器
docker-compose -p cadvisor -f docker-compose_cadvisor.yml up -d
- 成功后浏览器访问
- job_name: 'cadvisor' scrape_interval: 5s static_configs: - targets: ['192.168.9.140:18080']
- 修改配置文件后需重启
docker restart CONTAINER ID
- 成功后如下图

配置Grafana
- 添加Dashboards,导入模板
Warning: Error fetching server time: Detected 785.6099998950958 seconds time difference between your browser and the server.
- 到装prometheus的机器上,同步一下时钟
ntpdate time3.aliyun.com
redis_exporter
- prometheus.yml配置不正确可能会提示too many redis instances
- redis_exporter启动后通过Prometheus服务web页面/targets下scrape也可能会出现以下错误,此时一般为redis_exporter启动时密码配置不正确,如部分redis实例不需要密码强行配置密码,或者redis实例需要密码而没有配置密码
- redis_exporter_last_scrape_error{err="dial redis: unknown network redis"} 1mysqld_exporter
- 创建mysql用户时可能提示以下错误
ERROR 1290 (HY000): The MySQL server is running with the --skip-grant-tables option so it cannot execute this statement
- 刷新权限后再次执行即可
flush privileges;
后记
- 除了上述Linux服务器、Redis、Mysql等,还可以通过其他exporter监控对应组件,工具不是万能的,适合并且能够快速定位性能瓶颈最重要。
参考文档
redis集群监控:prometheus+redis_exporter+grafana-博客园
通过prometheus实现的docker部署mysql监控
理论要掌握,实操不能落!以上关于《Prometheus&Grafana性能监控》的详细介绍,大家都掌握了吧!如果想要继续提升自己的能力,那么就来关注golang学习网公众号吧!
- 修改配置文件后需重启
- 编辑
- 修改配置文件后需重启
- 编辑
- 创建
- 修改配置文件后需重启
- redis集群,
- 修改配置文件后需重启
- 编辑
- 或者使用docker安装,创建
- 编辑
- 创建
- 编辑
声明:本文转载于:SegmentFault 如有侵犯,请联系study_golang@163.com删除
相关阅读
更多>
-
374 收藏
-
499 收藏
-
160 收藏
-
105 收藏
-
117 收藏
最新阅读
更多>
课程推荐
更多>
-

- 前端进阶之JavaScript设计模式
- 设计模式是开发人员在软件开发过程中面临一般问题时的解决方案,代表了最佳的实践。本课程的主打内容包括JS常见设计模式以及具体应用场景,打造一站式知识长龙服务,适合有JS基础的同学学习。
- 立即学习 543次学习
-

- GO语言核心编程课程
- 本课程采用真实案例,全面具体可落地,从理论到实践,一步一步将GO核心编程技术、编程思想、底层实现融会贯通,使学习者贴近时代脉搏,做IT互联网时代的弄潮儿。
- 立即学习 516次学习
-

- 简单聊聊mysql8与网络通信
- 如有问题加微信:Le-studyg;在课程中,我们将首先介绍MySQL8的新特性,包括性能优化、安全增强、新数据类型等,帮助学生快速熟悉MySQL8的最新功能。接着,我们将深入解析MySQL的网络通信机制,包括协议、连接管理、数据传输等,让
- 立即学习 500次学习
-

- JavaScript正则表达式基础与实战
- 在任何一门编程语言中,正则表达式,都是一项重要的知识,它提供了高效的字符串匹配与捕获机制,可以极大的简化程序设计。
- 立即学习 487次学习
-

- 从零制作响应式网站—Grid布局
- 本系列教程将展示从零制作一个假想的网络科技公司官网,分为导航,轮播,关于我们,成功案例,服务流程,团队介绍,数据部分,公司动态,底部信息等内容区块。网站整体采用CSSGrid布局,支持响应式,有流畅过渡和展现动画。
- 立即学习 485次学习
评论列表
-

- 故意的唇彩
- 太细致了,mark,感谢楼主的这篇博文,我会继续支持!
- 2023-03-22 23:23:23
-
- 明理的发带
- 这篇文章内容出现的刚刚好,作者加油!
- 2023-03-19 05:19:56
-
- 务实的泥猴桃
- 这篇文章内容真是及时雨啊,好细啊,写的不错,已加入收藏夹了,关注up主了!希望up主能多写数据库相关的文章。
- 2023-03-18 06:09:57
-
- 香蕉月饼
- 赞 ??,一直没懂这个问题,但其实工作中常常有遇到...不过今天到这,看完之后很有帮助,总算是懂了,感谢作者分享文章!
- 2023-03-17 01:04:29
-
- 活力的大船
- 这篇技术文章真及时,太全面了,赞 ??,已加入收藏夹了,关注老哥了!希望老哥能多写数据库相关的文章。
- 2023-02-01 11:18:46
-
- 清爽的镜子
- 这篇技术文章出现的刚刚好,细节满满,感谢大佬分享,mark,关注作者了!希望作者能多写数据库相关的文章。
- 2023-01-31 04:05:20