解决echarts的多个折现数据出现坐标和值对不上的问题
来源:SegmentFault
时间:2023-01-25 16:48:21 265浏览 收藏
本篇文章向大家介绍《解决echarts的多个折现数据出现坐标和值对不上的问题》,主要包括MySQL、nginx、github、spring、javascript,具有一定的参考价值,需要的朋友可以参考一下。
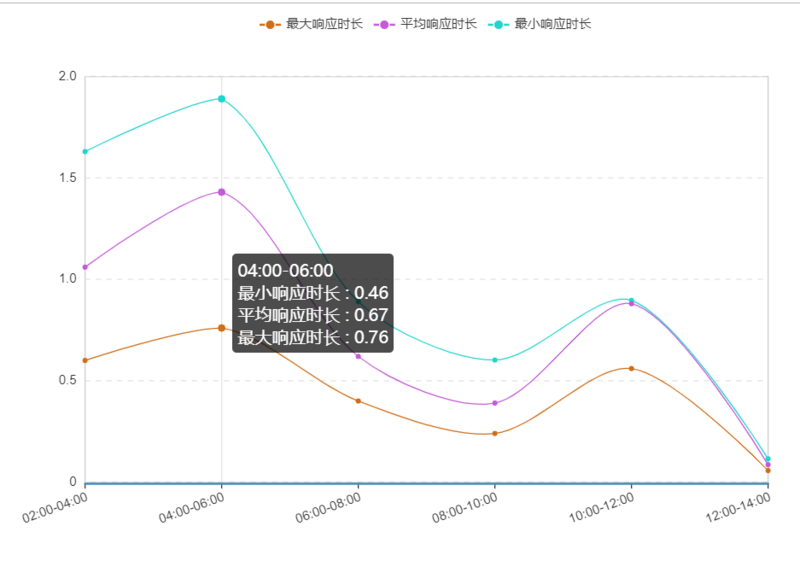
当出现多个折现数据,echarts可以配置stack值使用堆积值还是单个值
option = {
    noDataLoadingOption: {
     text: '暂无数据',
     effect: 'bubble',
     effectOption: {effect: {n: 0}}, textStyle: {fontSize: 24}
    },
    symbolList: ['circle'],
    tooltip: {
     trigger: 'axis', textStyle: {align: 'left'},
     axisPointer: {lineStyle: {color: '#E3E3E3', width: 1, type: 'solid'},}
    },
    // grid: {x: '60px', x2: '60px', borderWidth: 0},
    legend: {data: ['最大响应时长', '平均响应时长', '最小响应时长']},
    toolbox: {show: true},
    // calculable: true,
    xAxis: [{
      type: 'category',
      boundaryGap: false,
      data: ['00:00-02:00', '02:00-04:00', '04:00-06:00', '06:00-08:00', '08:00-10:00', '10:00-12:00'],
      splitLine: {lineStyle: {width: 0}},
      axisLabel: {interval: 0,/*横轴信息全部显示*/  rotate: 20,/*20度角倾斜显示*/}
     }],
    yAxis: [{
      type: 'value',
      axisLine: {lineStyle: {color: '#333', width: 0, type: 'solid'}},
      splitLine: {lineStyle: {color: '#e3e3e3', width: 1, type: 'dashed'}},
     }],
    series: [
     {
      name: '最大响应时长',
      smooth: true,
      type: 'line',
      stack: '总量', // 重要的点 这个参数会使用堆积值作为纵坐标的刻量值。
      data:[........],
      itemStyle: {normal: {color: '#D06E17', lineStyle: {width: 1, color: '#D06E17'}}}
     },{
      name: '平均响应时长',
      smooth: true,
      type: 'line',
      stack: '总量', // 重要的点 这个参数会使用堆积值作为纵坐标的刻量值。
      data:[........],
      itemStyle: {normal: {color: '#C35AD9', lineStyle: {width: 1, color: '#C35AD9'}}}
     },{
      name: '最小响应时长',
      smooth: true,
      type: 'line',
      stack: '总量', // 重要的点 这个参数会使用堆积值作为纵坐标的刻量值。
      data:[........],
      itemStyle: {normal: {color: '#1FD5CE', lineStyle: {width: 1, color: '#1FD5CE'}}}
     },
   ]
option3 = {
noDataLoadingOption: {
text: '暂无数据',
effect: 'bubble',
effectOption: {effect: {n: 0}}, textStyle: {fontSize: 24}
},
symbolList: ['circle'],
tooltip: {
trigger: 'axis', textStyle: {align: 'left'},
axisPointer: {lineStyle: {color: '#E3E3E3', width: 1, type: 'solid'},}
},
// grid: {x: '60px', x2: '60px', borderWidth: 0},
legend: {data: ['最大响应时长', '平均响应时长', '最小响应时长']},
toolbox: {show: true},
// calculable: true,
xAxis: [{
type: 'category',
boundaryGap: false,
data: ['00:00-02:00', '02:00-04:00', '04:00-06:00', '06:00-08:00', '08:00-10:00', '10:00-12:00'],
splitLine: {lineStyle: {width: 0}},
axisLabel: {interval: 0,/*横轴信息全部显示*/ rotate: 20,/*20度角倾斜显示*/}
}],
yAxis: [{
type: 'value',
axisLine: {lineStyle: {color: '#333', width: 0, type: 'solid'}},
splitLine: {lineStyle: {color: '#e3e3e3', width: 1, type: 'dashed'}},
}],
series: [
{
name: '最大响应时长',
smooth: true,
type: 'line',
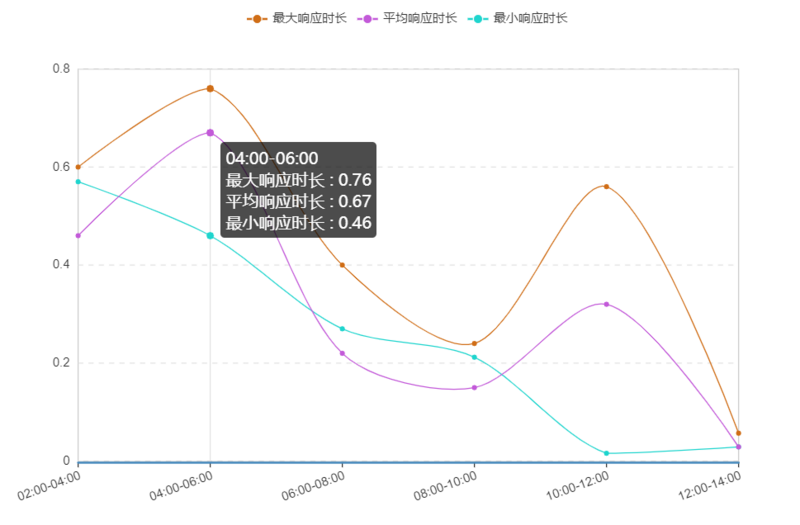
// stack: '总量', // 去除stack这个参数
itemStyle: {normal: {color: '#D06E17', lineStyle: {width: 1, color: '#D06E17'}}}
},{
name: '平均响应时长',
smooth: true,
type: 'line',
// stack: '总量', // 去除stack这个参数
itemStyle: {normal: {color: '#C35AD9', lineStyle: {width: 1, color: '#C35AD9'}}}
},{
name: '最小响应时长',
smooth: true,
type: 'line',
// stack: '总量', // 去除stack这个参数
itemStyle: {normal: {color: '#1FD5CE', lineStyle: {width: 1, color: '#1FD5CE'}}}
},
]
};终于介绍完啦!小伙伴们,这篇关于《解决echarts的多个折现数据出现坐标和值对不上的问题》的介绍应该让你收获多多了吧!欢迎大家收藏或分享给更多需要学习的朋友吧~golang学习网公众号也会发布数据库相关知识,快来关注吧!
声明:本文转载于:SegmentFault 如有侵犯,请联系study_golang@163.com删除
相关阅读
更多>
-
499 收藏
-
244 收藏
-
235 收藏
-
157 收藏
-
101 收藏
最新阅读
更多>
-
数据库 · MySQL | 1天前 | 性能优化 · 执行计划 · MySQL教程 · 慢查询治理 · 数据库运维 · mysql GROUP BY优化 TempTable 内部临时表 Created_tmp_disk_tables267 收藏
-
数据库 · MySQL | 1天前 | 性能优化 · InnoDB · MySQL教程 · 数据库运维 · 高并发写入 · mysql innodb 批量写入 Change Buffer innodb_change_buffering270 收藏
-
数据库 · MySQL | 4天前 | 性能优化 · 高并发 · InnoDB · MySQL教程 · 数据库运维 · mysql innodb AUTO_INCREMENT 高并发写入 innodb_autoinc_lock_mode254 收藏
-
数据库 · MySQL | 4天前 | 连接池 · 高并发 · 故障排查 · MySQL教程 · 数据库运维 · mysql 高并发 连接池 max_connections Too many connections491 收藏
-
381 收藏
-
数据库 · MySQL | 5天前 | 性能优化 · InnoDB · 故障排查 · MySQL教程 · DBA实战 · mysql innodb 性能优化 预热 冷启动 MySQL 8.4 Buffer Pool158 收藏
-
数据库 · MySQL | 5天前 | binlog · 故障恢复 · 备份恢复 · MySQL教程 · DBA实战 · mysql DBA binlog 备份恢复 mysqlbinlog MySQL 8.4 PITR432 收藏
-
数据库 · MySQL | 5天前 | 字符集 · 故障排查 · MySQL教程 · 索引优化 · 排序规则 · mysql 排序规则 索引优化 utf8mb4 collation MySQL 8.4294 收藏
-
数据库 · MySQL | 5天前 | binlog · 主从复制 · 故障排查 · MySQL教程 · DBA实战 · mysql DBA binlog 主从复制 MySQL 8.4 复制延迟 relay log119 收藏
-
数据库 · MySQL | 5天前 | MySQL教程 · 慢查询治理 · 索引优化 · 分区表 · DBA实战 · mysql 分区表 慢查询 索引优化 MySQL 8.4 partition pruning133 收藏
-
数据库 · MySQL | 5天前 | 高并发 · 故障排查 · MySQL教程 · 事务隔离 · InnoDB锁 · mysql innodb 高并发 锁等待 MySQL 8.4 NOWAIT SKIP LOCKED439 收藏
-
291 收藏
课程推荐
更多>
-

- 前端进阶之JavaScript设计模式
- 设计模式是开发人员在软件开发过程中面临一般问题时的解决方案,代表了最佳的实践。本课程的主打内容包括JS常见设计模式以及具体应用场景,打造一站式知识长龙服务,适合有JS基础的同学学习。
- 立即学习 543次学习
-

- GO语言核心编程课程
- 本课程采用真实案例,全面具体可落地,从理论到实践,一步一步将GO核心编程技术、编程思想、底层实现融会贯通,使学习者贴近时代脉搏,做IT互联网时代的弄潮儿。
- 立即学习 516次学习
-

- 简单聊聊mysql8与网络通信
- 如有问题加微信:Le-studyg;在课程中,我们将首先介绍MySQL8的新特性,包括性能优化、安全增强、新数据类型等,帮助学生快速熟悉MySQL8的最新功能。接着,我们将深入解析MySQL的网络通信机制,包括协议、连接管理、数据传输等,让
- 立即学习 500次学习
-

- JavaScript正则表达式基础与实战
- 在任何一门编程语言中,正则表达式,都是一项重要的知识,它提供了高效的字符串匹配与捕获机制,可以极大的简化程序设计。
- 立即学习 487次学习
-

- 从零制作响应式网站—Grid布局
- 本系列教程将展示从零制作一个假想的网络科技公司官网,分为导航,轮播,关于我们,成功案例,服务流程,团队介绍,数据部分,公司动态,底部信息等内容区块。网站整体采用CSSGrid布局,支持响应式,有流畅过渡和展现动画。
- 立即学习 485次学习
评论列表
-

- 俊逸的钢笔
- 这篇文章内容真及时,太全面了,真优秀,收藏了,关注作者了!希望作者能多写数据库相关的文章。
- 2023-02-21 11:52:43
-
- 耍酷的心锁
- 这篇文章真及时,细节满满,很有用,码住,关注博主了!希望博主能多写数据库相关的文章。
- 2023-02-10 01:40:34